Bewegung eines Probekörpers um ein rotierendes schwarzes Loch
Im folgenden wird die Geodätengleichung in vorgegebener Kerr-Raumzeit (in Boyer-Lindquist Koordinaten) betrachtet. Die Geodätengleichung beschreibt wie sich ein Probekörper (Masse = 0) im Raum bewegt und sagt voraus, dass diese Bewegung sich stehts entlang der kürzesten Kurve, in der durch die Metrik beschriebenen gekrümmten Raumzeit, vollzieht.
Eigenschaften der Kerr-Metrik
| > | restart:
with( tensor ): with(plots): with(plottools): |
Definition der kovarianten Raumzeit-Metrik eines rotierenden schwarzen Lochs der Masse M und Rotation a in Boyer-Lindquist Koordinaten (a ist ein spezifischer Drehimpuls a=J/M und wird als der sogenannte Kerr-Rotationsparameter bezeichnet):
| > | coord := [t, r, theta, phi]:
rho2:=r^2+(a*cos(theta))^2: Delta:=r^2-2*M*r+a^2:Sig2:=(r^2+a^2)^2-a^2*Delta*(sin(theta))^2: g_compts := array(symmetric,sparse, 1..4, 1..4): g_compts[1,1] := (1-2*M*r/rho2): g_compts[1,4] := +(2*a*M*r*(sin(theta))^2)/rho2: g_compts[2,2] :=-rho2/Delta: g_compts[3,3] := -rho2: g_compts[4,4] := -(r^2+a^2+2*M*r*a^2*(sin(theta))^2/rho2): g := create( [-1,-1], eval(g_compts)); |
| (2.1.1) |
Berechnung der kontravarianten Metrik, der Christoffel Symbole, des Riemanntensors...:
| > | ginv := invert( g, 'detg' ):
D1g := d1metric( g, coord ): D2g := d2metric( D1g, coord ): Cf1 := Christoffel1( D1g ): Cf2:= Christoffel2( ginv, Cf1 ): D2g := d2metric ( D1g, coord ): RMN := Riemann( ginv, D2g, Cf1 ): RICCI := Ricci( ginv, RMN ): RS := Ricciscalar( ginv, RICCI ): |
Berechnung des infinitesimalen Weglängenelements ds²:
| > | dx:=create([1], array([dt,dr,dtheta,dphi])):
ds2:=get_compts(prod(dx,lower(g,dx,1),[1,1])): ds2:=collect( simplify(ds2), [dt,dr,dtheta,dphi]); |
| (2.1.2) |
| > | ds2a:=simplify(coeff(ds2, dt, 2)):
ds2b:=simplify(coeff(ds2, dr, 2)): ds2c:=simplify(coeff(ds2, dtheta, 2)): ds2d:=simplify(coeff(ds2, dphi, 2)): ds2e:=simplify(coeff(ds2, dphi, 1)/dt): ds2:=ds2a*dt^2+ds2e*dt*dphi+ds2b*dr^2+ds2c*dtheta^2+ds2d*dphi^2; |
| (2.1.3) |
Struktur der Ereignishorizonte, Flächen der stationären Grenze und Flächen unendlicher Rotverschiebung
Die Flächen der stationären Grenze (stationary limit surfaces) und die der unendlichen Rotverschiebung sind durch g_00=0 bestimmt:
| > | UnRot:=solve(get_compts(g)[1,1]=0,r); |
| (2.1.1.1) |
Die Ereignishorizonte sind durch g^11=0 bestimmt:
| > | Horizon:=solve(get_compts(ginv)[2,2]=0,r); |
| (2.1.1.2) |
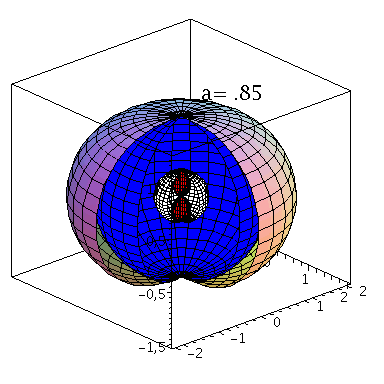
Grafische Veranschaulichung der Horizonte (a=0.95):Hier wurde das Maple-File verändert
| > | with(StringTools):
setM:=1: seta:=0.85: A:=plot3d({subs({M=setM,a=seta},UnRot[1])},phi=0..1.5*Pi,theta=0..Pi,coords=spherical,scaling=constrained): B:=plot3d({subs({M=setM,a=seta},UnRot[2])},phi=0..1.7*Pi,theta=0..Pi,coords=spherical,scaling=constrained,color=red): C:=plot3d({subs({M=setM,a=seta},Horizon[1])},phi=0..1.6*Pi,theta=0..Pi,coords=spherical,scaling=constrained,color=blue): DD:=plot3d({subs({M=setM,a=seta},Horizon[2])},phi=0..1.6*Pi,theta=0..Pi,coords=spherical,scaling=constrained,color=white): Ptext:=textplot3d([1, 1,2, Join(["a=",convert(seta,string)])], align =LEFT,color=black,font = [TIMES, ROMAN, 15]): display({A,B,C,DD,Ptext},axes=boxed,orientation=[-42,66], scaling=constrained); |
 |
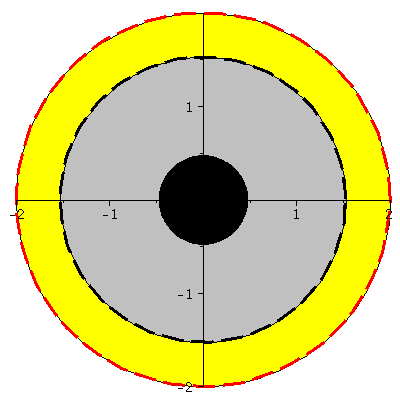
Horizontstruktur in der äquatorialen Ebene (Gelb: Ergosphäre, grau: Bereich zwischen äußerem und innerem Ereignishorizont, a=0.95):
| > | A:=implicitplot(r = subs({M=setM,a=seta,theta=Pi/2},UnRot[1]), r = 0 .. 3, phi = 0 .. 2*Pi, coords = polar,grid=[30,30],color=red,linestyle=dash,thickness=3):
B:=implicitplot(r = subs({M=setM,a=seta,theta=Pi/2},UnRot[2]), r = 0 .. 3, phi = 0 .. 2*Pi, coords = polar,grid=[30,30],color=red,linestyle=solid): C:=implicitplot(r = subs({M=setM,a=seta,theta=Pi/2},Horizon[1]), r = 0 .. 3, phi = 0 .. 2*Pi, coords = polar,grid=[30,30],color=black,linestyle=dash,thickness=3): DD:=implicitplot(r = subs({M=setM,a=seta,theta=Pi/2},Horizon[2]), r = 0 .. 3, phi = 0 .. 2*Pi, coords = polar,grid=[30,30],color=black,linestyle=solid): BH1:=display(disk([0,0],subs({M=setM,a=seta,theta=Pi/2},Horizon[2]),color=black)): BH2:=display(disk([0,0],subs({M=setM,a=seta,theta=Pi/2},Horizon[1]),color=grey)): BH3:=display(disk([0,0],subs({M=setM,a=seta,theta=Pi/2},UnRot[1]),color=yellow)): display({A,B,C,DD,BH1,BH2,BH3},scaling=constrained); |
 |
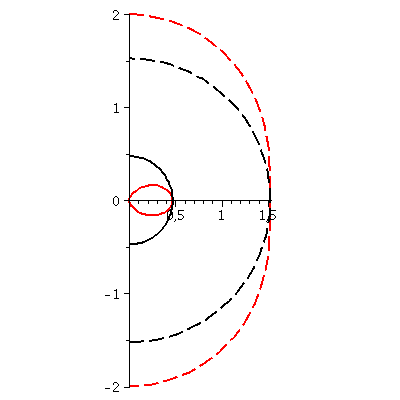
Horizontstruktur in der polaren Ebene (a=0.95):
| > | A:=implicitplot(r = subs({M=setM,a=seta},UnRot[1]), r = 0 .. 3, theta = -Pi/2 .. Pi/2, coords = polar,grid=[30,30],color=red,linestyle=dash,thickness=2):
B:=implicitplot(r = subs({M=setM,a=seta},UnRot[2]), r = 0 .. 3, theta = -Pi/2 .. Pi/2, coords = polar,grid=[30,30],color=red,linestyle=solid,thickness=2): C:=implicitplot(r = subs({M=setM,a=seta},Horizon[1]), r = 0 .. 3, theta = -Pi/2 .. Pi/2, coords = polar,grid=[30,30],color=black,linestyle=dash,thickness=2): DD:=implicitplot(r = subs({M=setM,a=seta},Horizon[2]), r = 0 .. 3, theta = -Pi/2 .. Pi/2, coords = polar,grid=[30,30],color=black,linestyle=solid,thickness=2): BH1:=display(disk([0,0],subs({M=setM,a=seta},Horizon[2]),color=black)): BH2:=display(disk([0,0],subs({M=setM,a=seta},Horizon[1]),color=grey)): BH3:=display(disk([0,0],subs({M=setM,a=seta},UnRot[1]),color=yellow)): display({A,B,C,DD},scaling=constrained); |
 |
Berechnung der Geodätengleichung als Funktion des affinen Parameters lambda. Die Geodätengleichung ist ein System gekoppelter Differentialgleichungen: Hier wurde das Maple-File verändert
| > | eqns:=geodesic_eqns( coord, lambda, Cf2 ): |
Umschreiben der Variablen in den Bewegungsgleichungen (z.B. r->r(lambda)):
| > | eq1:=simplify(subs({r=r(lambda),theta=theta(lambda)},eqns[1])):
eq2:=simplify(subs({r=r(lambda),theta=theta(lambda)},eqns[2])): eq3:=simplify(subs({r=r(lambda),theta=theta(lambda)},eqns[3])): eq4:=simplify(subs({r=r(lambda),theta=theta(lambda)},eqns[4])): eq1:=simplify(subs({r(lambda)(lambda)=r(lambda),theta(lambda)(lambda)=theta(lambda)},eq1)): eq2:=simplify(subs({r(lambda)(lambda)=r(lambda),theta(lambda)(lambda)=theta(lambda)},eq2)): eq3:=simplify(subs({r(lambda)(lambda)=r(lambda),theta(lambda)(lambda)=theta(lambda)},eq3)): eq4:=simplify(subs({r(lambda)(lambda)=r(lambda),theta(lambda)(lambda)=theta(lambda)},eq4)): |
:Infinitesimales Weglängenelement ds²:
| > | dx:=create([1], array([dt,dr,dtheta,dphi])):
ds2:=get_compts(prod(dx,lower(g,dx,1),[1,1])): ds2:=collect( simplify(ds2), [dt,dr,dtheta,dphi]): ds2a:=simplify(coeff(ds2, dt, 2)): ds2b:=simplify(coeff(ds2, dr, 2)): ds2c:=simplify(coeff(ds2, dtheta, 2)): ds2d:=simplify(coeff(ds2, dphi, 2)): ds2e:=simplify(coeff(ds2, dphi, 1)/dt): ds2:=ds2a*dt^2+ds2e*dt*dphi+ds2b*dr^2+ds2c*dtheta^2+ds2d*dphi^2; |
| (2.1.4) |
Festlegung der Anfangswerte:Hier wurde das Maple-File verändert
| > | setM:=1:
seta:=0.85: r0:=8.3: t0:=0: theta0:=Pi/2: phi0:=0: dr0:=0: dtheta0:=0: dphi0:=0.041: dt0:=solve(subs({theta=theta0,dphi=dphi0,dr=dr0,dtheta=dtheta0,M=1,a=seta,r=r0},ds2)=1,dt)[1]: |
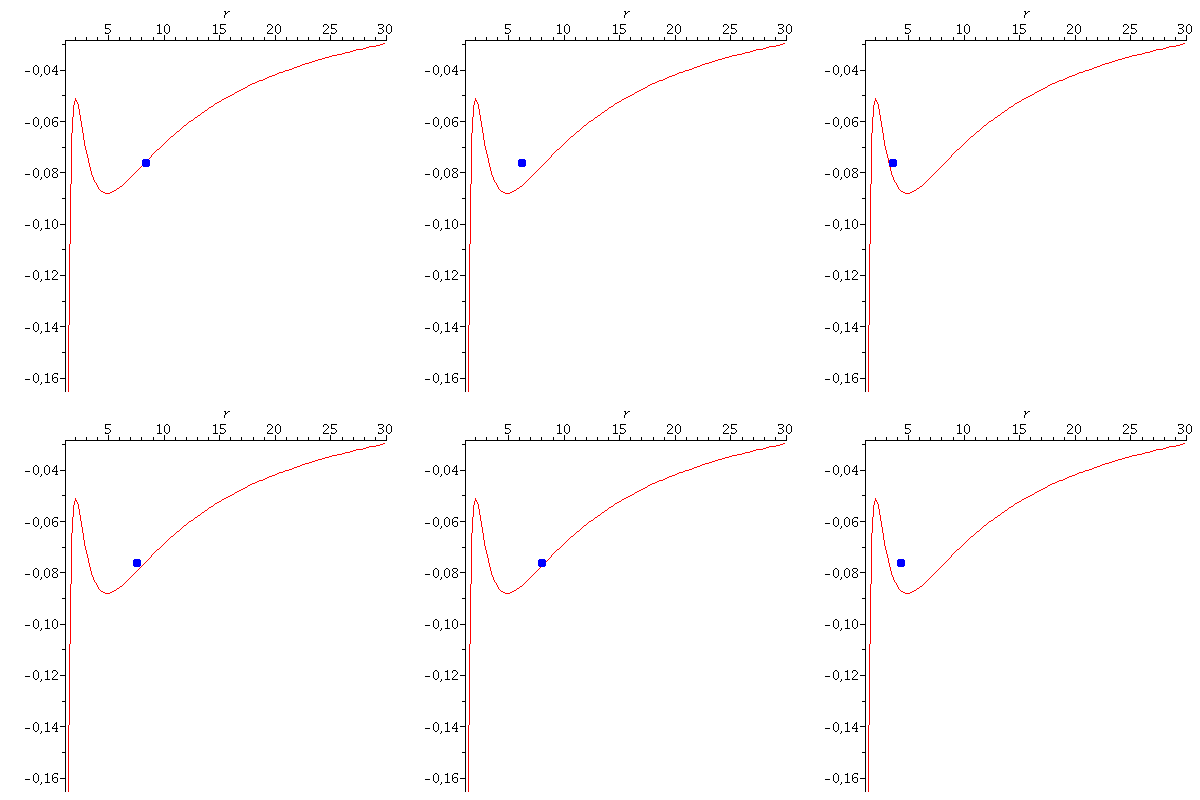
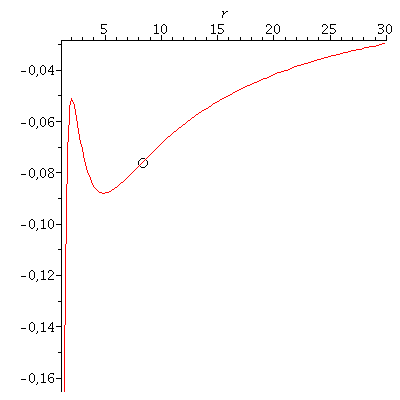
In der Literatur wird die Bewegung eines Probekörpers um ein rotierendes schwarzes Loch mittels eines definierten, effektiven Potentials illustriert (siehe z.B. Hartle- bzw. Hobson Buch). Dieses Potential hängt von dem, bei der Bewegung erhaltenem Drehimpuls pro Masse m und der Probekörper-Energie pro Masse ab. Die im Zentralfeld möglichen Bewegungen werden mittels zweier erhaltener Größen (l: Drehimpuls pro Masse m und E: Energie pro Masse) charakteriesiert. Die folgende Abbildung zeigt (in der Nomenklatur vom Hartle-Buch) das effektive Potential als Funktion des Radius bei den obigen gewählten Anfangswerten:
| > | Equ1:=solve({dt=1/Delta*((r^2+a^2+2*M*a^2/r)*energie-2*M*a/r*drehimpuls),dphi=1/Delta*((1-2*M/r)*drehimpuls+2*M*a/r*energie)},{energie,drehimpuls}):
setE:=subs({dt=dt0,dphi=dphi0,M=setM,a=seta,r=r0},rhs(Equ1[1])): setl:=subs({dt=dt0,dphi=dphi0,M=setM,a=seta,r=r0},rhs(Equ1[2])): VeffHartleRot:=(r,M,l,a,en)->-M/r+(l^2-a^2*(en^2-1))/(2*r^2)-M*(l-a*en)^2/r^3; PotRot:=plot(VeffHartleRot(r,setM,setl,seta,setE),r=1.4..30): B:=pointplot({[r0, VeffHartleRot(r0,1,setl,seta,setE)]}, symbol=circle,symbolsize=20): display(B,PotRot); |
 |
Numerische Lösung bei vorgegebenen Anfangswerten:
| > | Loes:=dsolve({subs({a=seta,M=setM},eq1),subs({a=seta,M=setM},eq2),subs({a=seta,M=setM},eq3),subs({a=seta,M=setM},eq4),t(0)=t0,r(0)=r0,phi(0)=phi0,theta(0)=theta0,D(r)(0)=0,D(t)(0)=dt0,D(phi)(0)=dphi0,D(theta)(0)=dtheta0},{r(lambda),t(lambda),phi(lambda),theta(lambda)},type=numeric,output=listprocedure): |
Grafische Veranschaulichung der Lösung:Hier wurde das Maple-File verändert
| > | lend:=400:
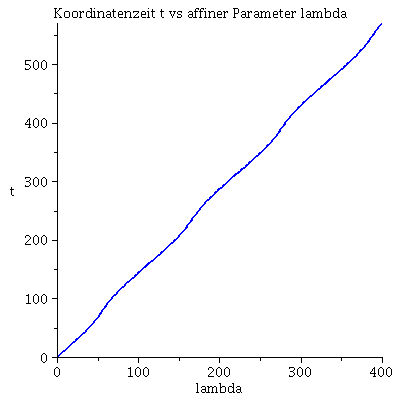
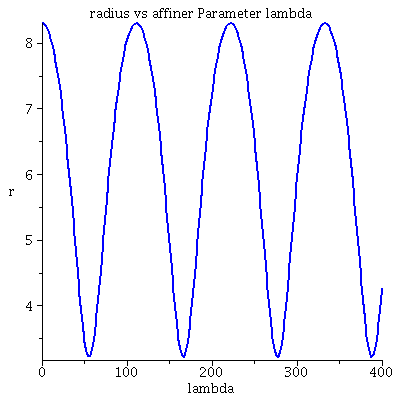
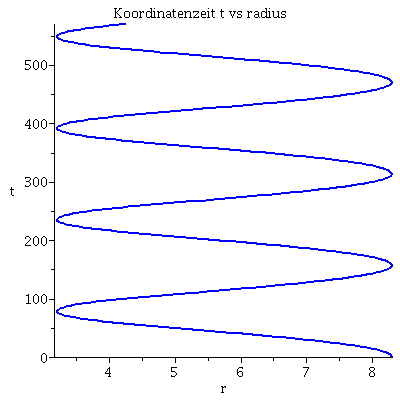
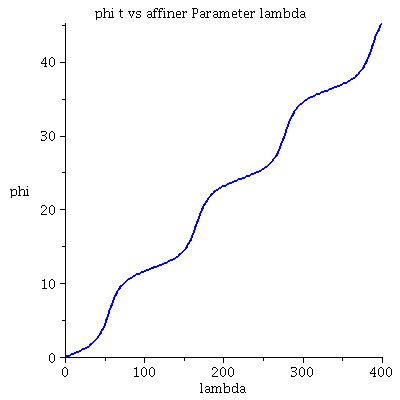
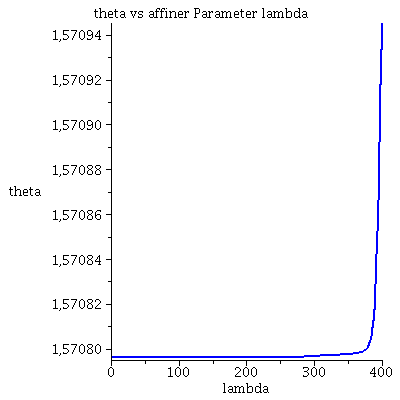
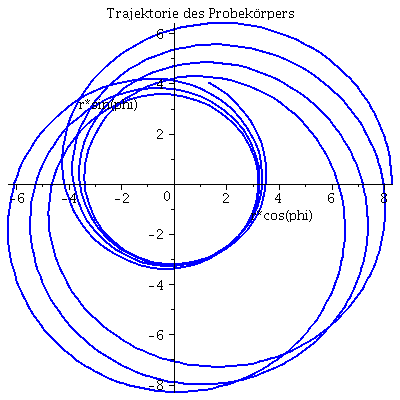
Plot1:=odeplot(Loes,[lambda,t(lambda)],0..lend,numpoints=200,color=blue,thickness=2,title="Koordinatenzeit t vs affiner Parameter lambda"): Plot2:=odeplot(Loes,[lambda,r(lambda)],0..lend,numpoints=200,color=blue,thickness=2,title="radius vs affiner Parameter lambda"): Plot3:=odeplot(Loes,[r(lambda),t(lambda)],0..lend,numpoints=700,color=blue,thickness=2,title="Koordinatenzeit t vs radius"): Plot4:=odeplot(Loes,[lambda,phi(lambda)],0..lend,numpoints=200,color=blue,thickness=2,title="phi t vs affiner Parameter lambda"): Plot5:=odeplot(Loes,[lambda,theta(lambda)],0..lend,numpoints=200,color=blue,thickness=2,title="theta vs affiner Parameter lambda"): Plot6:=odeplot(Loes,[r(lambda)*cos(phi(lambda)),r(lambda)*sin(phi(lambda))],0..lend,numpoints=700,color=blue,thickness=2,title="Trajektorie des Probekörpers"): display(Matrix(1,3,[Plot1,Plot2,Plot3])); display(Matrix(1,3,[Plot4,Plot5,Plot6])); |
|
||||
|
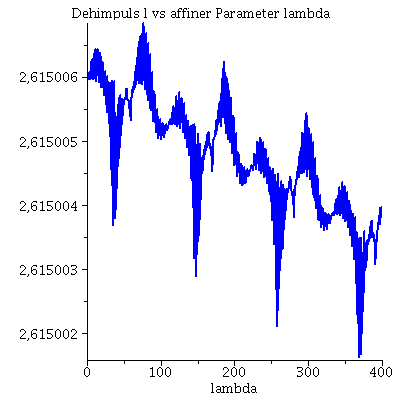
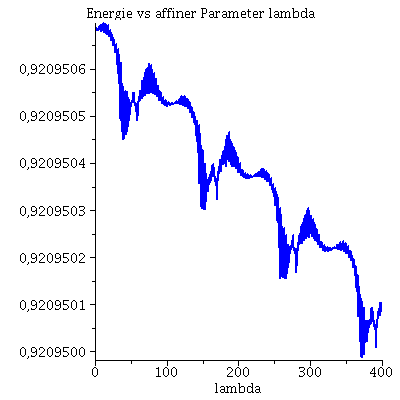
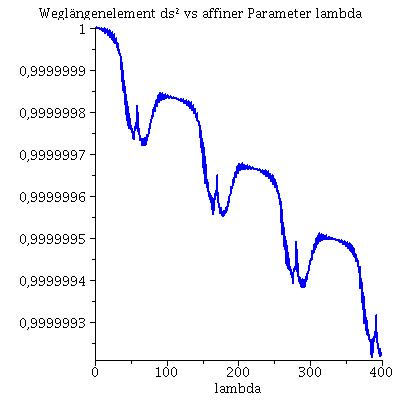
Während der Bewegung erhaltenen Größen (l: Drehimpuls pro Masse m, E: Energie pro Masse und Weglängenelement ds²): Hier wurde das Maple-File verändert
| > | Plot4:=odeplot(Loes,[lambda,subs({dt=diff(t(lambda), lambda),dphi=diff(phi(lambda), lambda),M=1,a=seta,r=r(lambda)},rhs(Equ1[2]))],0..lend,numpoints=700,color=blue,thickness=2,title="Dehimpuls l vs affiner Parameter lambda"):
Plot5:=odeplot(Loes,[lambda,subs({dt=diff(t(lambda), lambda),dphi=diff(phi(lambda), lambda),M=1,a=seta,r=r(lambda)},rhs(Equ1[1]))],0..lend,numpoints=700,color=blue,thickness=2,title="Energie vs affiner Parameter lambda"): Plot6:=odeplot(Loes,[lambda,subs({a=seta,M=1,r=r(lambda),phi=phi(lambda),theta=theta(lambda),dr=diff(r(lambda), lambda),dt=diff(t(lambda), lambda),dphi=diff(phi(lambda), lambda),dtheta=diff(theta(lambda), lambda)},ds2)],0..lend,numpoints=700,color=blue,thickness=2,title="Weglängenelement ds² vs affiner Parameter lambda"): display(Matrix(1,3,[Plot4,Plot5,Plot6])); |
|
| > | UnRot:=solve(get_compts(g)[1,1]=0,r):
Horizon:=solve(get_compts(ginv)[2,2]=0,r): A:=implicitplot(r = subs({M=setM,a=seta,theta=Pi/2},UnRot[1]), r = 0 .. 3, phi = 0 .. 2*Pi, coords = polar,grid=[30,30],color=red,linestyle=dash,thickness=1): B:=implicitplot(r = subs({M=setM,a=seta,theta=Pi/2},UnRot[2]), r = 0 .. 3, phi = 0 .. 2*Pi, coords = polar,grid=[30,30],color=red,linestyle=solid): C:=implicitplot(r = subs({M=setM,a=seta,theta=Pi/2},Horizon[1]), r = 0 .. 3, phi = 0 .. 2*Pi, coords = polar,grid=[30,30],color=black,linestyle=dash,thickness=1): DD:=implicitplot(r = subs({M=setM,a=seta,theta=Pi/2},Horizon[2]), r = 0 .. 3, phi = 0 .. 2*Pi, coords = polar,grid=[30,30],color=black,linestyle=solid): BH1:=display(disk([0,0],subs({M=setM,a=seta,theta=Pi/2},Horizon[2]),color=black)): BH2:=display(disk([0,0],subs({M=setM,a=seta,theta=Pi/2},Horizon[1]),color=white)): BH3:=display(disk([0,0],subs({M=setM,a=seta,theta=Pi/2},UnRot[1]),color=yellow)): BH:=display({A,B,C,DD,BH1,BH2,BH3},scaling=constrained): |
| > | frames:=150:
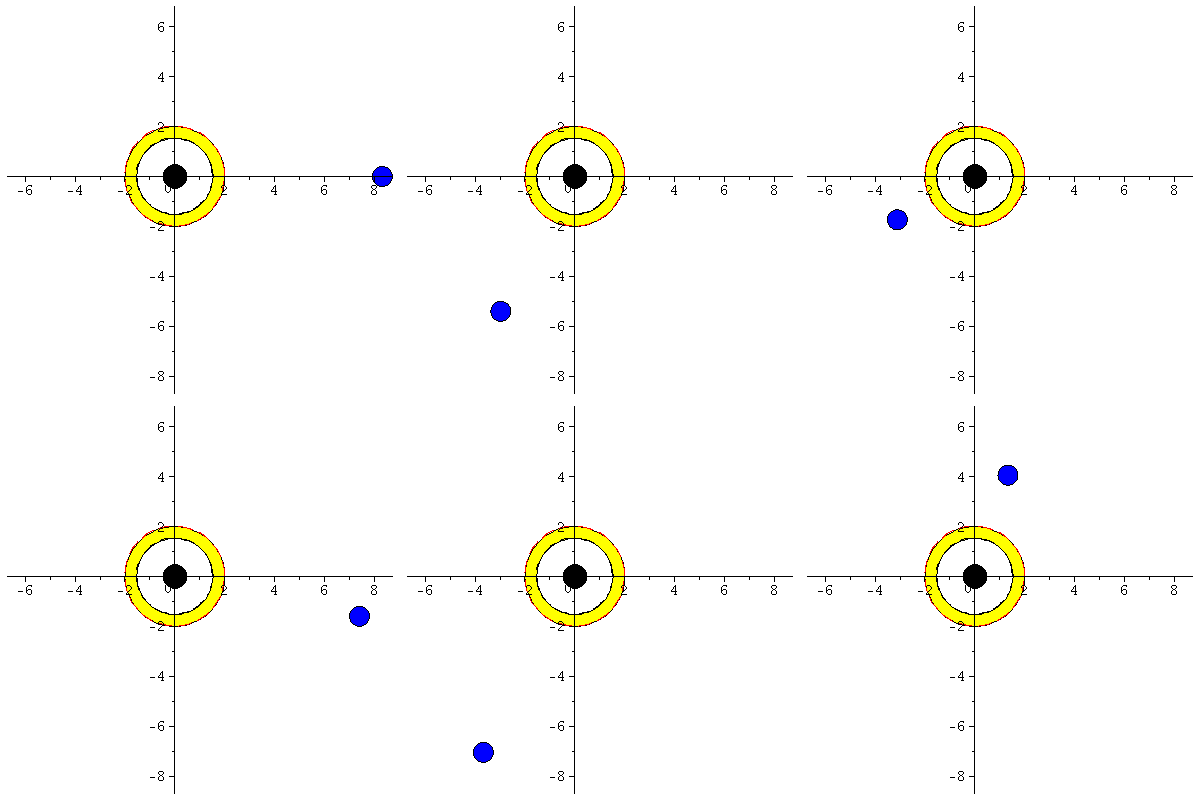
Lr := subs(Loes,r(lambda)): Lphi := subs(Loes,phi(lambda)): for i from 0 by 1 to frames do Koerper[i]:=display(disk([Lr(i*lend/frames)*cos(Lphi(i*lend/frames)),Lr(i*lend/frames)*sin(Lphi(i*lend/frames))],0.4,color=blue)): Ani[i]:=display({Koerper[i],BH}); od: |
| > | display([seq(Ani[i],i=0..frames)],insequence=true,scaling=constrained): |
| > | PotRot:=plot(VeffHartleRot(r,setM,setl,seta,setE),r=1.4..30):
VE:=VeffHartleRot(r0,1,setl,seta,setE): for i from 0 by 1 to frames do Koerper[i]:=pointplot({[Lr(i*lend/frames), VE]}, symbol=solidcircle,symbolsize=20,color=blue): Ani1[i]:=display({PotRot,Koerper[i]}); od: |
| > | Animat1:=display([seq(Ani[i],i=0..frames)],insequence=true,scaling=constrained):
Animat2:=display([seq(Ani1[i],i=0..frames)],insequence=true): display(Array([Animat1,Animat2])); |
|
| > |
| > |
