central limit theorem
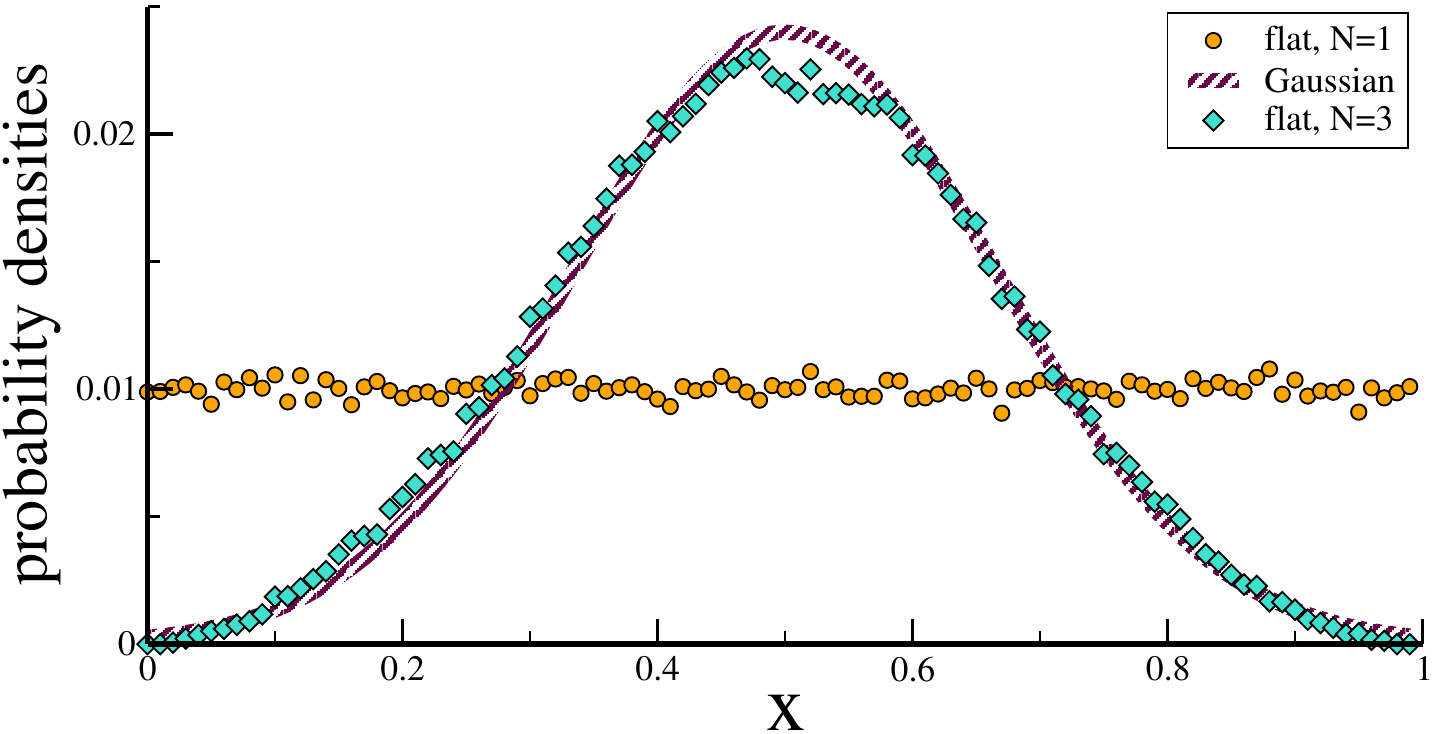
the probability distribution of a
sum of statistically independent
stochastic variables
converges to a Gaussian
sum of statistically independent
stochastic variables
converges to a Gaussian
- deep learning nets are large
:: Gaussian processes
law of large numbers
the variance of a
sum of statistically independent
stochastic variables
is additative
sum of statistically independent
stochastic variables
is additative
- $\sigma^2 = \sum_i \sigma_i^2$
Copy
Copy to clipboad
Downlaod
Download
#!/usr/bin/env python3

# sum of uniform distributions, binning with
# np.histogram()

import numpy as np               # numerics
import matplotlib.pyplot as plt  # plotting

nData = 10000
nBins = 20

# ploting at bin midpoints
xData = [(iBin+0.5)/nBins for iBin in range(nBins)]

# (adding) uniform distributions in [0,1]
data_1 = [ np.random.uniform()      for _ in range(nData)]
data_2 = [(np.random.uniform()+\
           np.random.uniform())/2.0 for _ in range(nData)]
data_3 = [(np.random.uniform()+\
           np.random.uniform()+\
           np.random.uniform())/3.0 for _ in range(nData)]

hist_1, bins = np.histogram(data_1, bins=nBins, range=(0.0,1.0))
hist_2, bins = np.histogram(data_2, bins=nBins, range=(0.0,1.0))
hist_3, bins = np.histogram(data_3, bins=nBins, range=(0.0,1.0))
#print("Bin Edges", bins)
#print("Histogram Counts", hist_1)

y_one   = hist_1*nBins*1.0/nData      # normalize
y_two   = hist_2*nBins*1.0/nData
y_three = hist_3*nBins*1.0/nData

plt.plot(xData, y_one,   "ob", markersize=4, label="flat-one")
plt.plot(xData, y_two,   "og", markersize=4, label="flat-two")
plt.plot(xData, y_three, "or", markersize=4, label="flat-three")
plt.plot(xData, y_three,  "r")
#
plt.xlim(0, 1)
plt.ylim(0, 2.5)
plt.legend(loc="upper right")
plt.savefig('foo.svg')
plt.show()