Machine Learning Primer -- Python Tutorial


Claudius Gros, WS 2024/25

Institut für theoretische Physik
Goethe-University Frankfurt a.M.

Utilities

NumPy / matplotlib

Copy Copy to clipboad
Downlaod Download
#!/usr/bin/env python3

import numpy as np               # for numerics
import matplotlib.pyplot as plt  # for plotting

class globalData:      # variables are static when not declared with 'self'
 dimX = 2              # x-dimension
 dimY = 3              # y-dimension
 dimZ = 2              # y-dimension

print("*******************")
print("global data example")
print("*******************")

yxArray = np.ones( (globalData.dimY, globalData.dimX) )
zyArray = np.ones( (globalData.dimZ, globalData.dimY) )
print('yxArray :\n',yxArray)
print('zyArray :\n',zyArray)
print('zy * yx :\n',np.matmul(zyArray,yxArray))       # matrix multiplication

print("****************")
print("plotting example")
print("****************")

nPoints = 400
xPoints = range(nPoints)
yPoints = [np.sin(0.01*np.pi*x) for x in xPoints]

plt.plot(xPoints, yPoints)
plt.show()

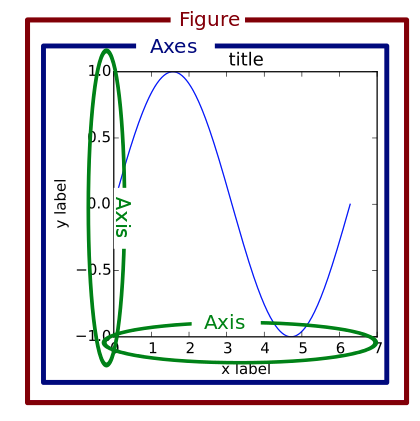
Matplotlib example


[Jan Meppe]
=============================================
character       description
=============================================
'-'             solid line style
'--'            dashed line style
'-.'            dash-dot line style
':'             dotted line style
'.'             point marker
','             pixel marker
'o'             circle marker
'v'             triangle_down marker
'^'             triangle_up marker
'<'             triangle_left marker
'>'             triangle_right marker
'1'             tri_down marker
'2'             tri_up marker
'3'             tri_left marker
'4'             tri_right marker
's'             square marker
'p'             pentagon marker
'*'             star marker
'h'             hexagon1 marker
'H'             hexagon2 marker
'+'             plus marker
'x'             x marker
'D'             diamond marker
'd'             thin_diamond marker
'|'             vline marker
'_'             hline marker
==================
character   color
==================
'b'         blue
'g'         green
'r'         red
'c'         cyan
'm'         magenta
'y'         yellow
'k'         black
'w'         white
Copy Copy to clipboad
Downlaod Download
#!/usr/bin/env python3

# importing matplotlib module
from matplotlib import pyplot as plt
from matplotlib.ticker import AutoMinorLocator

# equivalent import
# import matplotlib.pyplot as plt
 
# x-axis values
x = [5, 2, 9, 4, 7]
 
# Y-axis values
y = [10, 5, 8, 4, 2]

xMin, xMax, yMin, yMax = 2, 9, 2, 10
xTicks = range(xMin-1, xMax+2, 1)
yTicks = range(yMin  , yMax+1, 2)
 
# create figure / axis object
# quadratic outlay with figsize()
# subplots(nrows=1, ncols=1,...)

_, myAxis = plt.subplots(figsize=(10,10))

# sline are the axis / border
myAxis.spines['right'].set_linewidth(0.0)
myAxis.spines['top'].set_linewidth(0.0)
myAxis.spines['bottom'].set_linewidth(4.0)
myAxis.spines['left'].set_linewidth(4.0)

# axis start/end/labels
myAxis.axis([xMin, xMax, yMin, yMax])
myAxis.set_title('boring diagram', fontweight="bold", size=16)
myAxis.set_xlabel('x-label', fontsize = 16)
myAxis.set_ylabel('y-label', fontsize = 16) 

# major ticks by default
# minor ticks need to be activated
myAxis.tick_params(width=2, length=8, labelsize=12)
myAxis.xaxis.set_minor_locator(AutoMinorLocator())
myAxis.tick_params(which='minor', length=8, width=2, color='r')

# location of ticks
plt.setp(myAxis, xticks=xTicks, yticks=yTicks)

# plotting 
line, points = myAxis.plot(x, y, "--g",            # line
               x, y, "ob")             # points

# activate line lebel box
line.set_label('my line')
points.set_label('my points')
myAxis.legend(loc='upper center', fontsize='larger')
 
plt.show()
animated plotting

Copy Copy to clipboad
Downlaod Download
#!/usr/bin/env python3
# source
# https://matplotlib.org/stable/gallery/animation/rain.html

import matplotlib.pyplot as plt
import numpy as np
from matplotlib.animation import FuncAnimation

# fixing random state for reproducibility
np.random.seed(19680801)

# create new Figure and an Axes which fills it
fig = plt.figure(figsize=(7, 7))
ax = fig.add_axes([0, 0, 1, 1], frameon=False)
ax.set_xlim(0, 1), ax.set_xticks([])
ax.set_ylim(0, 1), ax.set_yticks([])

# rain drops as an array of specified data type ´dtype'
n_drops = 50
rain_drops = np.zeros(n_drops, dtype=[('position', float, (2,)),
                                      ('size',     float),
                                      ('growth',   float),
                                      ('color',    float, (4,))])

# random initial raindrops 
rain_drops['position'] = np.random.uniform(0, 1, (n_drops, 2))
rain_drops['growth'] = np.random.uniform(50, 200, n_drops)

# scatter plot, will be updated during animation
scat = ax.scatter(rain_drops['position'][:, 0], rain_drops['position'][:, 1],
                  s=rain_drops['size'], lw=0.5, edgecolors=rain_drops['color'],
                  facecolors='none')

#
# -- the update function
#
def update(frame_number):
# get an index which we can use to re-spawn the oldest raindrop
    current_index = frame_number % n_drops

# make all colors more transparent as time progresses
    rain_drops['color'][:, 3] -= 1.0/len(rain_drops)
    rain_drops['color'][:, 3] = np.clip(rain_drops['color'][:, 3], 0, 1)

# make circles bigger
    rain_drops['size'] += rain_drops['growth']

# pick a new position for oldest rain drop, 
# resetting its size
    rain_drops['position'][current_index] = np.random.uniform(0, 1, 2)
    rain_drops['size'][current_index] = 5
    rain_drops['color'][current_index] = (0, 0, 0, 1)
    rain_drops['growth'][current_index] = np.random.uniform(50, 200)

# update the scatter collection, with the new colors, sizes and positions
    scat.set_edgecolors(rain_drops['color'])
    scat.set_sizes(rain_drops['size'])
    scat.set_offsets(rain_drops['position'])

#
# --- animation, with the update function as the animation director
#
animation = FuncAnimation(fig, update, interval=10, save_count=100)
plt.show()


NumPy example

$$ L = \big\langle\,(y_p(x)-y_(x))^2\,\big\rangle = \sum_{x_i}\, (y_p(x_i)-y_(x_i))^2 $$ $$ a \ \ \to\ \ a-\epsilon\,\frac{\partial}{\partial a}\, L $$
Copy Copy to clipboad
Downlaod Download
#!/usr/bin/env python3

import numpy as np
import math
import matplotlib.pyplot as plt

# global parameters
nData = 2000                     # number of training pairs
nIter = 2000                     # number training iterations
nPar  =    4                     # number of fit parameters

learning_rate = 0.5e-2/nData     # relative learning rate
fitPar = []                      # empty list; fit parameters
for i in range(nPar):
  fitPar.append(np.random.randn())  
print(fitPar)

# fitting fuction
def fitFunction(x):
  sum = 0.0
  for i in range(nPar):
    sum += fitPar[i]*(x**i)
  return sum

# linespace returns a list
# training data: y= sin(x)
x = np.linspace(-math.pi, math.pi, nData)
y = np.sin(x)

# training iteration 
for iIter in range(nIter):
  y_pred = fitFunction(x)                  # list; element-wise
  loss = np.square(y_pred - y).sum()       # sum of squared elements

  if iIter % 100 == 99:                    # test printou
    print(f'{iIter:5d}  {loss:10.6f}')

  grad_y_pred = 2.0 * (y_pred - y)         # error signal
  for i in range(nPar):
    gradient = ( grad_y_pred*(x**i) ).sum()
    fitPar[i] -= learning_rate * gradient

# showing result
plt.plot(x, np.sin(x)                , 'b', label="sin(x)")
plt.plot(x, fitFunction(x)           , 'r', label="fit")
plt.plot(x, 0.0*x                    , '--k')
plt.legend()
plt.show()

slicing / filtering

Copy Copy to clipboad
Downlaod Download
#!/usr/bin/env python3
import numpy as np

x = np.array([0, 0, 1, 1, 2, 2])
y = np.array([8, 7, 6, 5, 3, 2])
z = np.array([[0, 6],
              [1, 7],
              [2, 8],
              [3, 9]])

print("\nx[:3]    ", x[:3])                # first 3 elements

print("\ny[] %    ", y[int(0.8*len(y)):])  # last 20%

print("\ny[::2]   ", y[::2])               # every second entry

print("\nx!=0     ", x!=0)                 # boolean array

print("\ny[x!=0]  ", y[x!=0])              # filtering

print("\n****************************")

print(z)

print("\nz[:,0]   ", z[:,0])               # only for np arrays

print("\nz[:,1]   ", z[:,1])

timing / in place operations

Copy Copy to clipboad
Downlaod Download
#!/usr/bin/env python3

import time           # time in seconds
import numpy as np    # NumPy

NN = int(1e7)         # summing NN squares

#
# --- plain Python implementation
#
start_time = time.time()
result_plain = sum([i**2 for i in range(1, NN+1)])
end_time = time.time()

print(f"plain python, result: {result_plain:20.12e}")
print(f"plain python, time  : {end_time - start_time:7.3f}  seconds")
print()

#
# --- NumPy implementation
#
start_time = time.time()
result_numPy = \
  np.sum(np.arange(1, NN+1, dtype=np.float64)**2, dtype=np.float64)
end_time = time.time()

print(f"NumPy,        result: {result_numPy:20.12e}")
print(f"NumPy,        time  : {end_time - start_time:7.3f}  seconds")

SciPy

scipy.iofile input/output
scipy.specialspecial functions
scipy.linalglinerar algebra
scipy.interpolate  interpolations
scipy.optimizeoptimization and fitting
scipy.statsstatistics and random numbers
scipy.integratenumerical integration
scipy.fftpackfast fourier transform
scipy.signalsignal processing
scipy.ndimageimage manipulation
Copy Copy to clipboad
Downlaod Download
#!/usr/bin/env python3

from scipy import linalg
import numpy as np

#square matrix
squareMatrix = np.array([ [5,4], [1,2] ])
print()
print("original / transposed matrix")
print(squareMatrix)
print(squareMatrix.T)
print()

#pass values to det() function
print("determinant    ", linalg.det(squareMatrix))
print()

# inverse 
print("inverse / inverse*matrix")
print(linalg.inv(squareMatrix))
print(squareMatrix.dot(linalg.inv(squareMatrix)))     # matrix multiplication
print()

#eigenvalues and vectors (as complex numbers)
print("eigenvalues | vectors")
eigenValues, eigenVectors = linalg.eig(squareMatrix)  # returning both
for ii in range(N:=len(eigenValues)):
  print(f'{ii:3d}  {np.real(eigenValues[ii]):7.4f} | ', end="")
  for jj in range(N):
    print(f'  {np.real(eigenVectors[ii][jj]):7.4f}', end="")
  print()


standard modules

import datetime
print("date   today    : ", datetime.date.today())
from datetime import date
print("date   today    : ", date.today())
Copy Copy to clipboad
Downlaod Download
#!/usr/bin/env python3

import os                       # operating system
import math                     # nomen est omen
import random                   # idem
import statistics
from datetime import date

print(os.getcwd())              # current working directory
os.system('ls')                 # execute 'ls' command
if  1==2 :
  os.system('mkdir myDir')      # execute 'mkdir'
  os.chdir('myDir')             # change working directory
  os.system('cp ../test.py .')  # copy
  os.system('./test.py')        # run script (yourself again)

print()
print("math   cos      : ", math.cos(math.pi/4)*math.sqrt(2.0))
print("math   log      : ", math.log(1024, 2))
print()
print("random choice   : ", random.choice(['apple', 'pear', 'banana']))
print("random sample   : ", random.sample(range(100), 4))
print("random random   : ", random.random())
print()
data = [2.75, 1.75, 1.25, 0.25, 0.5, 1.25, 3.5]
print("stat   mean     : ", statistics.mean(data))
print("stat   variance : ", statistics.variance(data))

containers

namedtuple()   tuples with named fields
deque two-headed list-like container with appends and pops on either end
ChainMap dictionary-like class for creating a single view of multiple mappings
Counter dictionary subclass for counting hashable objects
OrderedDict dictionary subclass that remembers the order entries were added
defaultdict dict subclass that allows to supply missing values
UserDict wrapper around dictionary objects for easier dict subclassing
UserList wrapper around list objects for easier list subclassing
UserString wrapper around string objects for easier string subclassing

Jupyter Notebook

for i in range(n:=5):
  n = n-1
  print(print(i,n))        # output?

workflow utilities

package installer

IDE - integrated development environment

version/project management

AI code suggestion/completion